Testing A Designed Wall Assembly
Archoverflow R-Value chart here
Thermal Gradient: Shows variance in temperature through a cross section of a construction assembly.
Dew Point Analysis: A thermal gradient line is drawn/developed from outside to inside based on the R-Values of the individual building materials for a specific design condition on the outside and inside. This analysis will allow the designer to find the point in the wall where the interior design temperature will meet its dew point.
- The goal is to verify where the dew point would occur, if at all, within the wall cavity.
- Generally speaking, this is only done for heating (during winter) time design conditions
For this analysis, the entire wall assembly is ‘simplified’. Things like brackets, connectors, hangers, etc. are removed and a ‘typical’ wall section is used. The performance would be different in spots including these components, especially if they are not thermally broken.
Design Guidelines
Codes and energy guidelines like ASHRAE will stipulate design temperature ranges, along with the site weather conditions. While these are recommendations, a project’s specifications will establish performance requirements that assemblies and products need to meet, especially if custom fabricated. In those cases, calculations and engineering should be submitted verifying the assembly meets the design criteria.
- Winter: ASHRAE recommends a design temperature of 68–74°F
- Summer: ASHRAE recommends a design temperature of 72–80°F
- ASHRAE recommends a relative humidity (RH) of 30–60% for indoor spaces
Drawing the Line
The line starts at the design temperature for the inside and outside, and you take the entire R-Value of the assembly and divide by the temperature difference. If all the values within the assembly were the same, such as a concrete wall, then the line would be linear and straight all the way through. Because the R-Values for these examples change, then the rate of the line changes.
- A larger slope means a better insulating material
- A flat or low slope means the component has very little insulating properties
Calculation
Temperature Change to Reference Point ΔTd = (R-Value of Component RC / R-Value of Total Assembly RT ) * Temperature Change between design conditions. ΔT
Variables Only:
ΔTd = ( RC / RT ) ΔT
Wall Assembly Examples
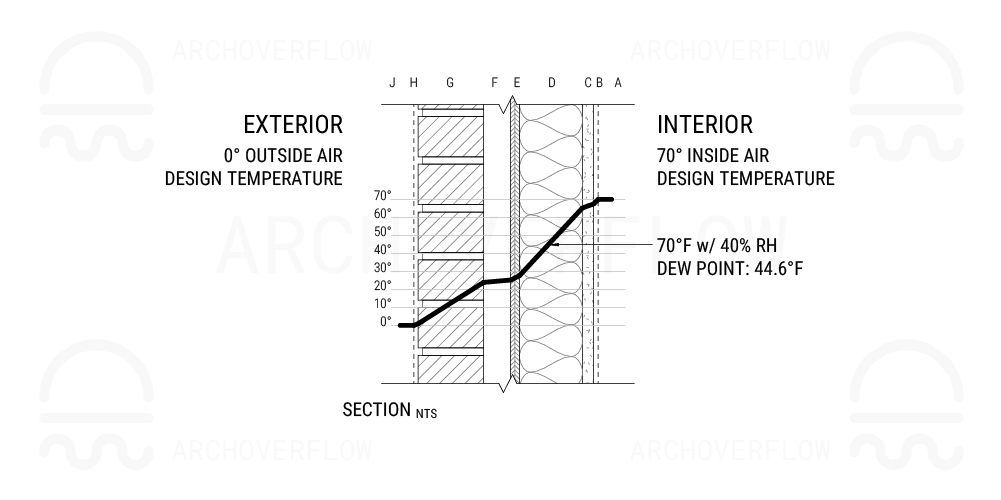
All the examples below assume an Interior Design Temp of 70°F, with 40% Humidity. The exterior design temperature is 0°F, which puts this theoretical project somewhere in the Northern United States.
- Dew Point of 70°F 40% RH = 44.6°F
- Note that in the component labels, “i” is not used for clarity.
- R-Values are taken from our R-Value chart here.
Wall Assembly A1
| Label | Component | R-Value/inch | Thickness (in) | Resistance (Rt) | Cumulative (Rc) | Temp Diff (Td) | Temp at Label |
|---|---|---|---|---|---|---|---|
| A | INSIDE AIR | – | – | – | – | – | 70.00 |
| B | INTERIOR AIR FILM | – | – | 0.68 | 0.68 | 2.12 | 67.88 |
| C | GYPSUM BOARD | 0.9 | 0.625 | 0.56 | 1.24 | 3.88 | 66.12 |
| D | INSULATION (FIBERGLASS BATT) | 3.4 | 3.5 | 11.90 | 13.14 | 41.05 | 28.95 |
| E | SHEATHING | 1.1 | 0.5 | 0.55 | 13.69 | 42.77 | 27.23 |
| F | AIRSPACE | 0.26 | 1.5 | 0.39 | 14.08 | 43.99 | 26.01 |
| G | BRICK | 2.25 | 3.625 | 8.16 | 22.24 | 69.47 | 0.53 |
| H | EXTERIOR AIR FILM | – | – | 0.17 | 22.41 | 70.00 | 0.00 |
| J | OUTSIDE AIR | – | – | – | – | – | 0.00 |
The dew point is reached somewhere inside the insulation. This assembly is required to have a vapor barrier on the warm side (between C-D) to prevent the moisture from reaching this location.
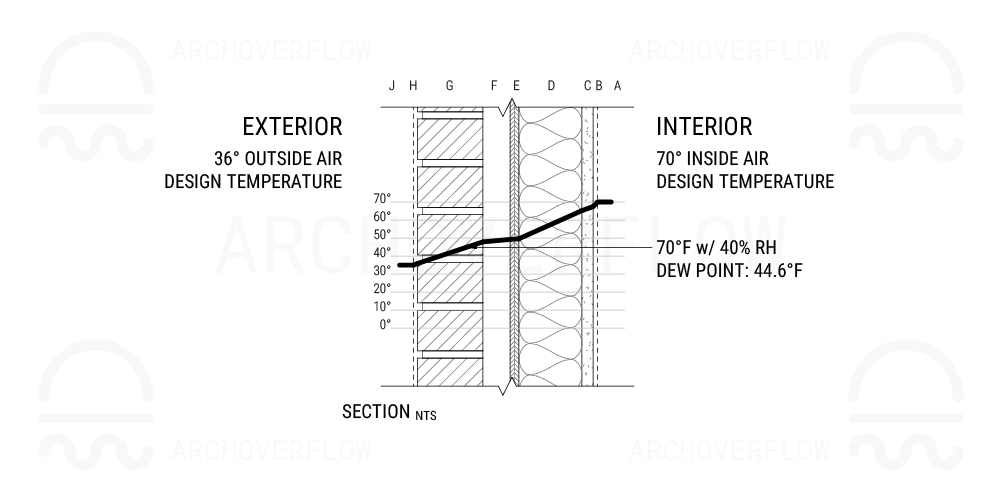
A2 – Changing Design Guidelines
| Label | Component | R-Value/inch | Thickness (in) | Resistance (Rt) | Cumulative (Rc) | Temp Diff (Td) | Temp at Label |
|---|---|---|---|---|---|---|---|
| A | INSIDE AIR | – | – | – | – | – | 70.00 |
| B | INTERIOR AIR FILM | – | – | 0.68 | 0.68 | 1.03 | 68.97 |
| C | GYPSUM BOARD | 0.9 | 0.625 | 0.56 | 1.24 | 1.89 | 68.11 |
| D | INSULATION | 3.4 | 3.5 | 11.90 | 13.14 | 19.94 | 50.06 |
| E | SHEATHING | 1.1 | 0.5 | 0.55 | 13.69 | 20.78 | 49.22 |
| F | AIRSPACE | 0.26 | 1.5 | 0.39 | 14.08 | 21.37 | 48.63 |
| G | BRICK | 2.25 | 3.625 | 8.16 | 22.24 | 33.74 | 36.26 |
| H | EXTERIOR AIR FILM | – | – | 0.17 | 22.41 | 34.00 | 36.00 |
| J | OUTSIDE AIR | – | – | – | – | – | 36.00 |
If we change the exterior design condition to 36°F — (An example would be for Nashville, TN) – you can see that the dew point would theoretically be reached in this condition somewhere around the masonry brick. In this location, it would not require a vapor barrier as the dew point would not be expected to occur within a negative portion of the wall cavity. However, it is just as important in this location to make sure the sheathing is protected and the air cavity properly ventilated and able to allow water to wick out if this were to occur.
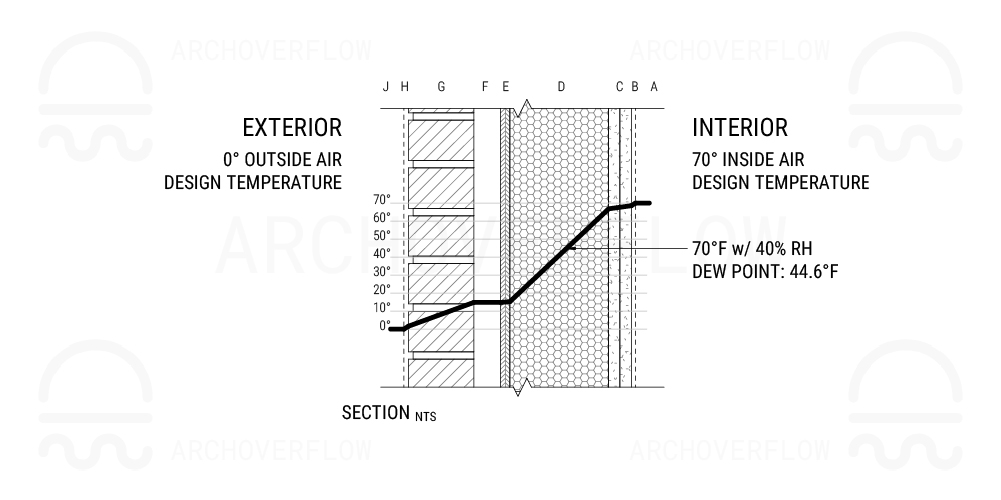
Wall Assembly B
| Label | Component | R-Value/inch | Thickness (in) | Resistance (Rt) | Cumulative (Rc) | Temp Diff (Td) | Temp at Label |
|---|---|---|---|---|---|---|---|
| A | INSIDE AIR | – | – | – | – | – | 70 |
| B | INTERIOR AIR FILM | – | – | 0.68 | 0.68 | 1.08 | 68.92 |
| C | GYPSUM BOARD (DOUBLE LAYER) | 0.9 | 1.125 | 1.01 | 1.69 | 2.70 | 67.30 |
| D | INSULATION (SPRAY-CLOSED) | 6 | 5.5 | 33.00 | 34.69 | 55.24 | 14.76 |
| E | SHEATHING | 1.1 | 0.5 | 0.55 | 35.24 | 56.12 | 13.88 |
| F | AIRSPACE | 0.26 | 1.5 | 0.39 | 35.63 | 56.74 | 13.26 |
| G | BRICK | 2.25 | 3.625 | 8.16 | 43.79 | 69.73 | 0.27 |
| H | EXTERIOR AIR FILM | – | – | 0.17 | 43.96 | 70.00 | 0.00 |
| J | OUTSIDE AIR | – | – | – | – | – | 0 |
In this theoretical wall assembly we are using spray insulation. Even in super insulated wall assemblies, the need for a vapor barrier is not mitigated in cold environments (the closed cell spray foam acts as a vapor barrier in this instance).
There is always the potential for moisture
An important thing to consider is that there is always the potential for moisture when looking at vast extremes in weather data. For example, when weather outside reaches historic lows of 30, 40 degrees below zero, this can skew the ability for a house or components to perform as they should. Generally speaking, you cannot design for 100% of the weather phenomenon expected to occur, and accept these as outliers.
Pasta New Years Eve Party
An energy expert once said to us, ‘well, if you had a pasta making party and everyone was boiling water and making pasta at midnight on new years eve, while it’s 20 below outside… of course there is going to be issues at that moment’.
They were basically pointing out that another aspect to consider is the relative humidity design temperature and the potential for moments in time to break the assumptions. Our examples use 40% which is difficult to achieve and maintain in the winter. However, in kitchens, it’s not uncommon to get humidity spikes during cooking, or even temperature spikes as well from ovens. In these instances, it’s known to be outliers of the norm, and they are accepted exceptions to the rule.


Leave a Reply
You must be logged in to post a comment.