Definitions
PERT: Project Evaluation Review Technique
Critical Path Method (CPM): Known as a Network Diagram; charting style with different paths and events in a diagram to show duration and task order.
Interface Events: When different portions of the projects are planned, per different scope of work or other reason, this would sometimes require different Network Diagrams. When the Network Diagrams have events that coincide with each other, these events are interface events and are named as such since they allow the two diagrams to connect/interface.
Float Path: All other paths besides the Critical Path are considered float paths. These are considered ‘Float Paths’ because they have built in ‘float’ to their time schedule.
Milestone Events: Important points in the construction process. These typically occur at a specific date. For example, issuing permits on December 1st. These are considered ‘checkpoints’ in the project.
Float: Amount of time in a task that that the task can be delayed without causing a delay in the subsequent task or project completion date.
- When the project is completely void of calendar date restrictions, critical tasks will have zero float in them, since a delay in these would cause a delay in the project schedule.
Introduction
A Critical Path Method Chart defines activities with a starting and stopping point as well as sequence of the activities and duration of those activities and how they interface together.
Note:
There is no graphical indication of time and the arrows/boxes/symbols will typically not be drawn to scale. There are slight variations with different CPM charts and how they are read or the information they convey — but typically each arrow is associated with the start and end of an event. However, if referencing a different chart, please note that it may not conform to this standard.
CPM vs GANTT Chart (Bar Chart)
On large projects, a CPM is typically prepared in addition to a GANNT chart, especially to show the breakdown of subcontractor work. A CPM is generally considered better for identifying bottlenecks than a GANTT chart because it shows durations and sequences as well as relationships between different items. Whereas the GANTT Diagram will show scheduled information in a more visual way and are generally easier to understand. Therefore, while the GANTT is still widely used and easier to understand, they are typically inferior to CPM diagrams for identifying critical path items.
CPM Overview
The Critical Path Method is the name of the overall strategy of showing time and events, however the Critical Path is something specific as well. It is generally shown as a heavy line or as a different color and is the path with the longest required total time.
- Activities along the critical path are critical activities. A delay in these activities would result in a delay in the completion of the total project. Therefore, these are some of the most important activities to monitor and if possible, reduce.
- To reduce project schedule, the GC/Builder/etc only needs to concentrate on shortening the critical path line. Even though they may only account for a small fraction of the activities on a site, a reduction here shortens the construction time.
- A task that leads to another task is a requirement to be completed before the next task can happen. For example, the subfloor needs to be installed prior to the finish floor being installed. So the finish floor is dependent on the subfloor being installed.
- One task can lead to multiple other tasks, or have multiple tasks required before it’s completed. There is no limit to the connections/tasks/nodes.
CPM Simple Typical
Each Event is a “node” (circle). These ‘events’ are defined as that moment when a preceding activity has been completed and the following activity may begin. The lines between nodes are activities that must be completed and are labeled with a length of time.
This means in the example below, #1 isn’t really a task, but the start of the project, the first task is technically the line between 1 and 2. Therefore you can label this task as (1-2) which will take 5 days. Once task (1-2) is complete you are at node 2, which allows the project to now undergo 3 new tasks (2-3), (2-4), (2-5).
Simple vs Complex
There are obviously variations between different types of CPM charts as mentioned before. The most common is a simple version with tasks and expected task length. A more complex version is to include more detail, such as expected shorter time and expected longer time to complete tasks. A version of this is below for comparison.
- You could also for example chart the secondary CPM paths, or even milestone nodes to the project. This could be something like a CPM ‘superstructure complete.’
- ARE Note: A simple CPM chart is what you can expect to identify and read on the ARE exams. Complex charts, if ever, will be something you encounter in the field.
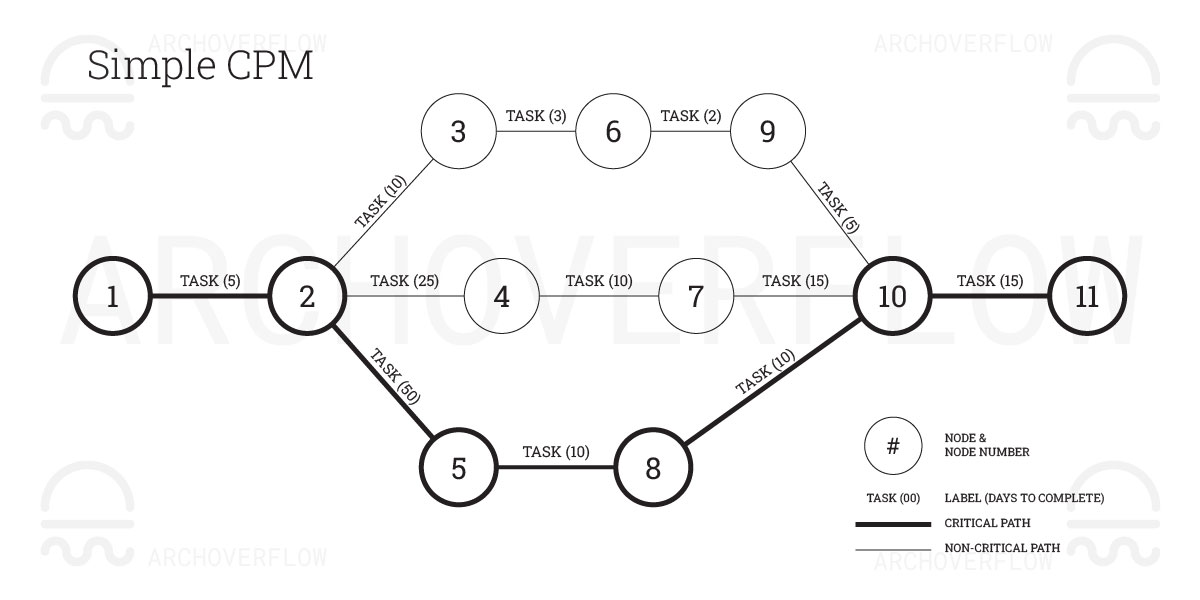
Example Diagram Basic:
- The Critical Path in the diagram above is 1-2-5-8-10-11.
- The total length for this in ‘days’ would be 5+50+10+10+15 = 90 Working Days
- To determine approximate calendar days… 90 * 7/5 = 126 Calendar Days
- Note: This wouldn’t take into account days off, float, holiday, etc.
- If Task 2-5 is completed on time, there is 25 days of float in Task 2-4
- This means Task 2-4 could be delayed up to 25 days and still not impact the schedule.
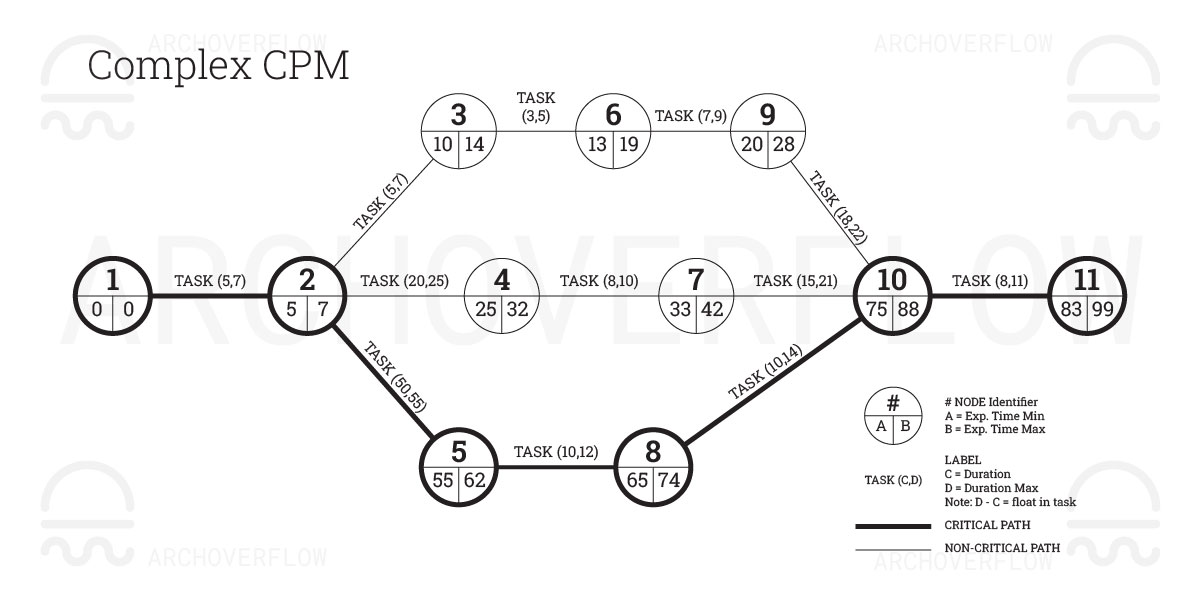
Example Diagram Complex:
- The Critical Path in the diagram above is the same as the simple: 1-2-5-8-10-11
- Total minimum length for this in ‘days’ would be 83, as listed in label A (see key)
- Built into the complex is float. Across the 5 tasks there is 16 days of float
- This means the maximum length would be expected to be 99 days. (ref Label B)
- Notice how even if path 1,2,4,7,10 takes the most amount of expected time, they are at node 10 after 63 days (42+21). This means there is theoretically 12 days (75-63) of float in case path 1,2,4,7,10 goes as slow as possible, and path 1,2,5,8,10 goes as fast as possible.


Leave a Reply
You must be logged in to post a comment.